3.8 Estimating ERGMs
Estimating $P*$ / ERGMs
- we have the probability of a graph now depends on some set of statistics of the graph($S_k(g)$) and multiplied by some parameters($\beta_k$)
$Pr(g) = \frac{exp(\sum\beta_kS_k(g))}{\sum_{g'}exp(\sum\beta_kS_k(g'))}$
The power of such models: we can put pretty much anything you want into those statistics. So if you wanted to keep track of links, triangles, you could make these based on covariates. So as we talked about in the block models, we could have links among blue nodes. And links among green nodes, links between blue and green nodes. Triangle involving blue, greens and yellows etc. So you could have all kinds of different statistics, keep track of those. And the idea, then, is that using this kind of model would allow us to test to see whether certain things are going to be significant or not. So are the parameters non-zero, are they positive, are they negative, what do they look like? That gives us some idea of how these different things matter in the formation of a graph.
Weakness: what's the difficulty, the challenge in these things is how are we going to estimate these?!
Example: Florentine Marriages
- Robins, Pattison, Kalish, Lusher(2007) fit an ERGM to Padgett and Ansel's Florentine data
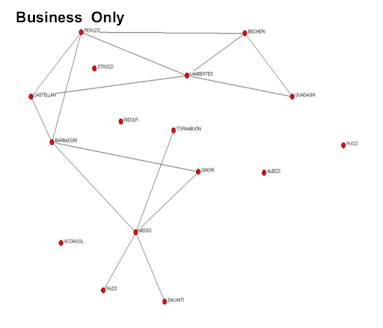
- Business ties between the 16 major families
- Fit: #links, two stars, three stars, trianles
We've got the probability of a graph depending on each one of these things, then we can ask what do these different parameters look like?
$Pr(g) = exp(\beta_1N_{links} + \beta_2N_{two stars} + \beta_3N_{three stars} + \beta_4N_{triangles} - c)$
Example: Florentine Families Business Dealings
You can use statnet, for instance, which is a program package in R, and you stick in your dataset and end up just directly trying to fit an exponential random graph model. It asks which kinds of things you want to throw in, and then it will spit out an answer.
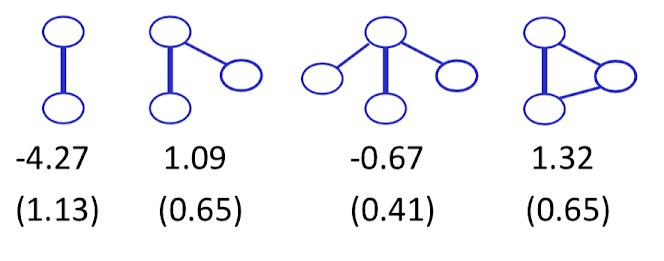
This example give us:
one links, we get a parameter of -4.27, standard error for about 1.13, so this is statistically significantly negative. So that's a network that doesn't like links. If we see the graph "Business Only", it's a fairly sparse network, so networks that have fewer links are going to be more probable under this model with the negative parameter there. Networks that have lots of links would be less probable. So it's not surprising that it gets a negative parameter here.
two stars, 1.09, like
- three stars, -0.67, dislike
- triangles, 1.32, like
Now exactly how we interpret those is a little complicated. It's complicate by two facts, one, we're not quite sure the combinations of these different things. So links are going to be inside two-stars, inside three-stars, and so forth. We also haven't given us any theory of exactly why the business dealing should have one type of structure or another. So going at this with a social theory would then allow us to make sense of these.
ERGMs
how these kinds of things are estimated and then what we should take away from those estimates. So what's the challenge in estimating an exponential random graph model?
$$Pr(g) = \frac{exp(\beta_1S_1(g) + ... + \beta_kS_k(g)}{\sum_{g'}exp(\beta_1S_1(g') + ... + \beta_kS_k(g'))}$$
So we put down our formulation, we've got a bunch of statistics, we want to see if they matter and to what extent they matter positively or negatively. And in order to make this a possibility, we had to sum over all the possible graphs of what this can be, okay? So the idea is, how likely graph g is depends on comparing it to how likely all the other graphs would be in order to figure out why this one got picked out and not any other one, okay?
So in order to go ahead and estimate this to figure out, for instance, if we want to do what's known as maximum likelihood estimation, what we would want to do is let's pick the parameters that actually make the given graph that we saw as probable as possible, okay? So which parameters would make this probability as high as possible, okay? Well, the difficulty is, in order to figure out which parameters maximize this function, we have to be able to do this sum in the denominator, right? And that's going to be tricky. Why is it going to be tricky? There's a lot of ground graphs to sum over. And so, a techniques of instead of actually doing an explicit calculation here, would be to try and estimate this instead. And we'll estimate this, the standard the technique, is using MCMC, Markov chain Monte Carlo techniques for estimation.
And this is because we can popularize by Tom Snijders, and Mark Handcock, who made some breakthroughs that allowed this to be applied to exponential random graph models, and that's what underlies the software. So instead of summing over all g primes, what we'll do is we'll sample some g primes and then try and extrapolate and estimate that denominator based on that. The program's a little more complicated, but essentially what it's doing is walking the space and trying to pick out different g primes and then based on that it can get a relative likelihood. And then figure out, by searching across different parameters, which parameters meet the highest likelihood of seeing the data we actually saw.

Issues:
Note $\sum_{g'}$ in $$Pr(g) = \frac{exp(\beta_1S_1(g) + ... + \beta_kS_k(g)}{\sum_{g'}exp(\beta_1S_1(g') + ... + \beta_kS_k(g'))}$$
Recall: n = 30 nodes, there are $2^{30*(30-1)/2} = 2^{435}$ g's (less than $2^{258}$ atoms in the universe...)
Sampling g's will not lead to accurate estimates(not just MCMC limitation)
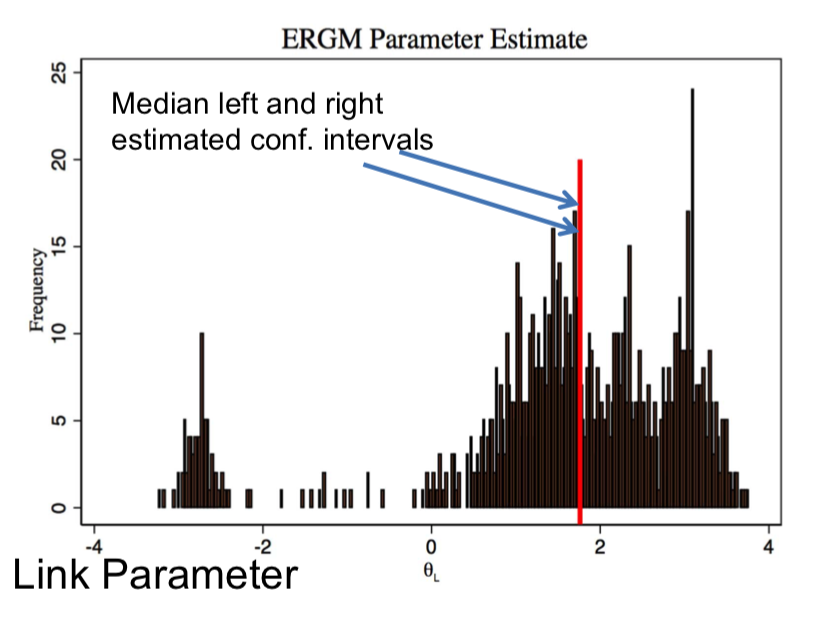
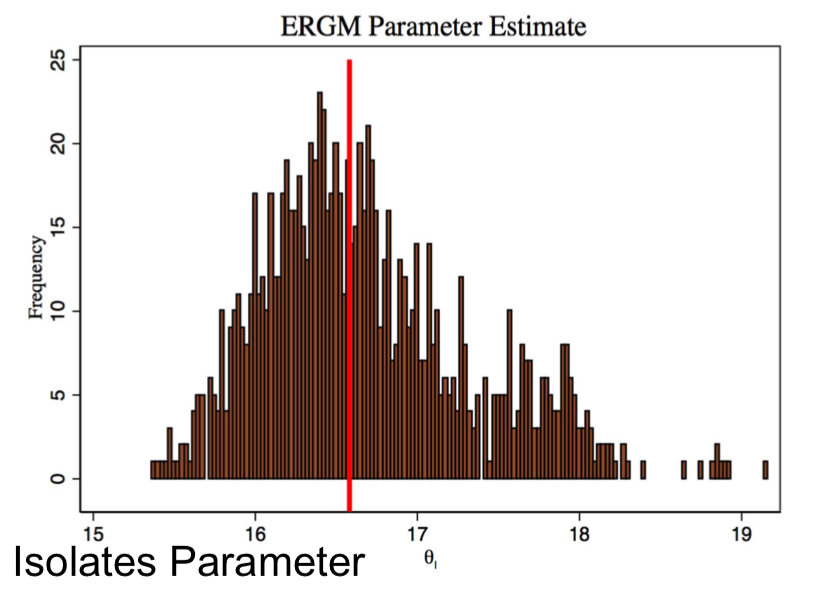
MCMC estimation techniques are inaccurate:
- Can one compute parameters?
- Consistency of estimators of ERGMs:
- When are parameters accurate and how many nodes are needed?
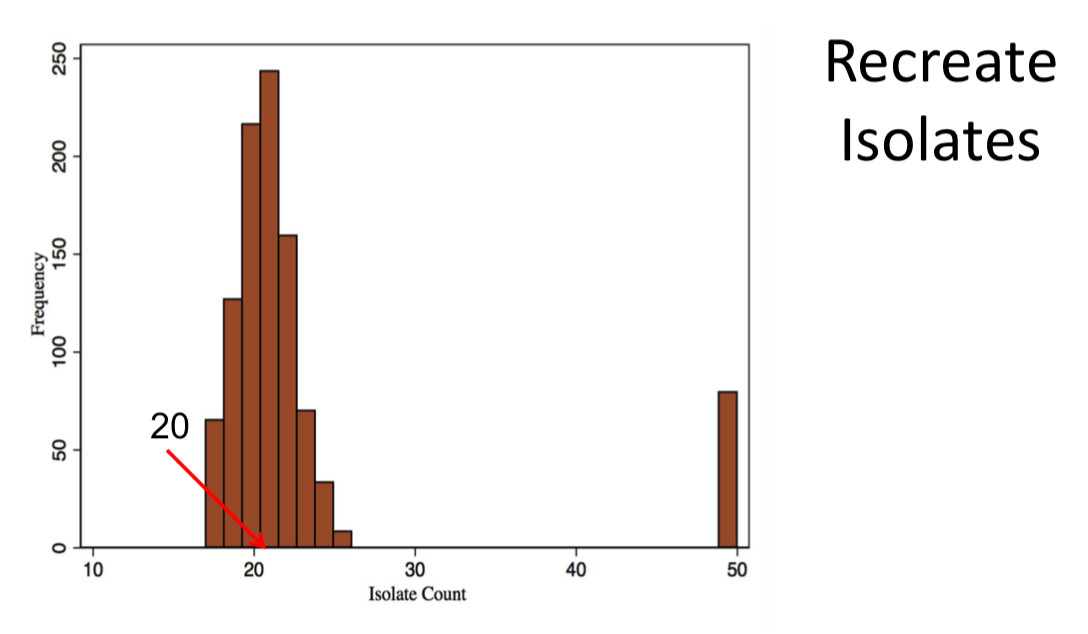
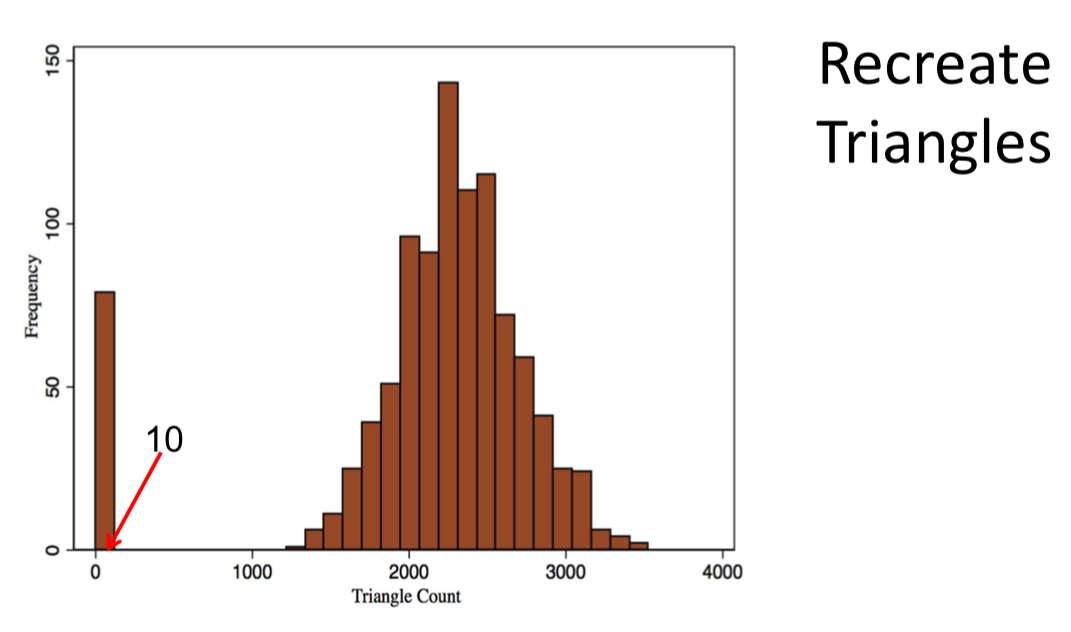
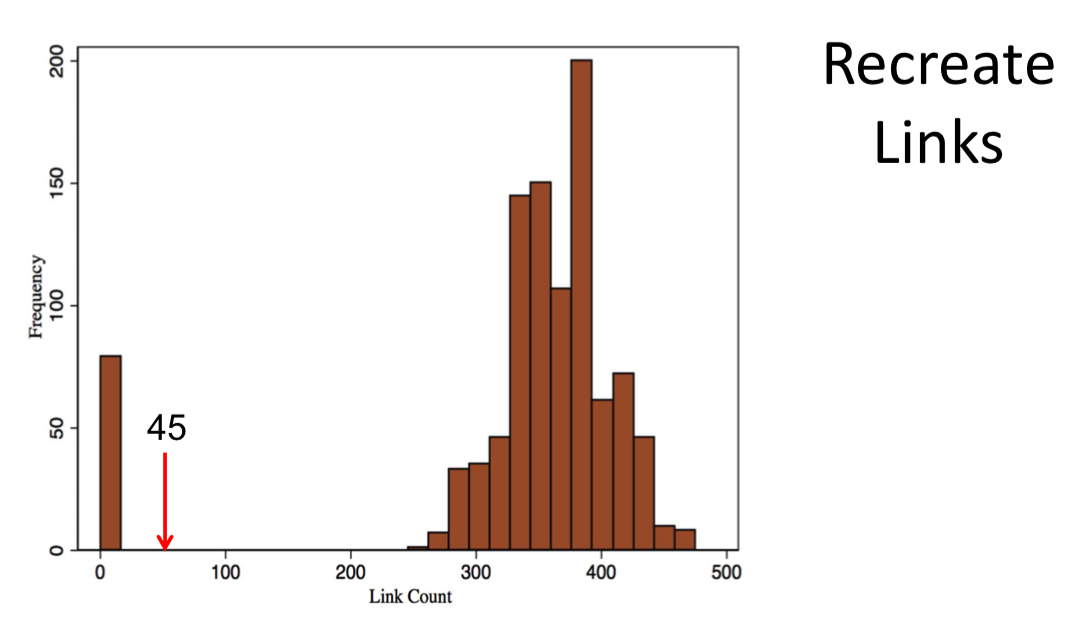
- How to generate networks randomly?
- Counterfactuals, validation...